Home Page
- Project: A project consists of a series of analytical models, project information, and location information which is used to evaluate the feasibility, relative attractiveness, and cost for each location. A project is identified by a single name which can be searched.
- Search Bar: A user can enter “text” into the box above the Search Button. This “text” will be referenced when the Search Button is selected.
- Search Button: The search button allows a user to reference their “My Projects” list. The button will seek projects with a name that match or partially match the “text” entered into the search bar. If a user clicks “search” without typing anything into the search bar, all projects in their database will appear.
Project Page – Create Project
- Project Name: The project name identifies each project. The project name is searchable and can be edited. A project name can be entered into the provided “text” box.
- Add Project: The Add Project button will add the new project to the user’s “My Projects” list. Once the project is added it will have a project card and be searchable.
Project Page – Existing Project
- Create Project: The Create Project button will begin a new project.
- Copy Project: The Copy Project option provides a user the option to duplicate an existing project. A project can be renamed and may include the location information or be copied with no location data.
- My Projects: The My Projects option will return the user to the “My Projects” list and screen.
- Info/Model: The Info/model button is provided on each project card. This button allows access to the project’s analytical models and project data model.
- All Locations: The Info/model button is provided on each project card. This button allows access to the project’s location cards and location data.
Project Page – Copy Project
- Project Name: The project name identifies each project. The project name is searchable and can be edited.
- Project to Copy: The Project to Copy dropdown list allows the user to select which project to duplicate.
- Include Locations: Should a user select the box to the right of “Include Locations” all location information from that project will also be duplicated.
- Copy Project: The Copy Project button will execute the duplication process. The duplication requires a few moments to complete. Once it is complete the new project can be accessed, edited, and searched.
Project Dashboard
- Project Data Model: The data model can be used to upload an existing model structure or to develop a new model in the app.
- Export Data Model: If a model is developed in the Data Request section, the Data Request document may be exported in excel format. This export includes primary, secondary, and tertiary categories, a tag, and a criteria for each datapoint. The exported Data Model can then be used to collect location data if the “Include Location Information Rows” option is selected.
- Want Analytic: The Want Analytic evaluates various criteria that are not necessary for the project but are desirous. The Want Analytic can be exported by selecting “WANT Results” under the Export dropdown list in the project menu bar. This export may take a few moments to complete.
- Must Analytic: The Must Analytic evaluates various criteria that are necessary for the project. The Must Analytic can be exported by selecting the “MUST Results” under the Export dropdown list in the project menu bar. More information on Model exports can be found in the export section.
- Financial Analytic: The Financial Analytic calculates provided rate information and project demand information along with provided costs to analyze Operating, Investment, and ESG Costs. The model can also be used to calculate revenue.
- Financial Factors: The cost factor section allows for project specific calculation inputs. A user can input project specific factors in this section. (i.e. An electricity rate may be provided for each location, but total demand must be multiplied by the rate to determine the electric cost. A user can input the total electricity demand as a cost factor then multiply this by the electricity rate in the Financial Analytic. Note: electricity demand can be provided on the project requirements page as well.
Project Dashboard – Project Profile
- Project Status: The project status dropdown list allows the user to indicate the project’s current standing.
- Closed: No longer active
- On Hold: May return to active status but not currently active
- Active: The project is currently under evaluation.
- Region
- Profile Icon: A user can upload an image which will display on the project card.
- Delete Project: The Delete Project button will permanently delete the project you are currently viewing.
Project Dashboard – Project Information
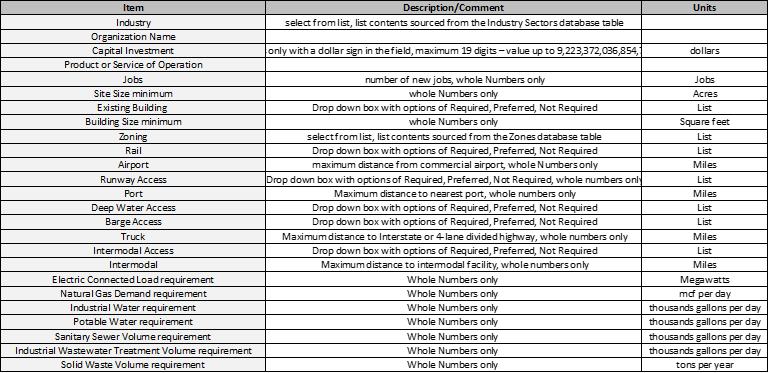
- Project Information: The project information page provides an easy singular place to list general project information. Select data points from this section can be referenced throughout the project.
- Industry: a user can assign an industry from the Industry dropdown list.
- Organization Name: a user can list the organization name associated with the project in this “text” box. The name is secure and cannot be viewed outside of this page.
- Capital Investment: List the total Capital investment amount
- Product/Service of Operation: a user can provide a brief description of the product or service to be manufactured or provided at the new facility.
- Number of New Jobs: List the total number of new full-time employees
- Location Size Minimum: List the minimum viable acreage required for the project
- Existing Building: Select whether an existing building is required, preferred, or not required
- Building Size Minimum: List the minimum viable building size (measured in square feet) required for the project
- Zoning: select the preferred zoning category require for the project
- Rail: Select whether rail is required, preferred, or not required
- Airport Maximum Distance: Indicate how far (driven miles) the project can locate from a commercial airport.
- Runway Access: Select whether runway access is required, preferred, or not required
- Port Maximum Distance: Indicate how far (driven miles) the project can locate from a commercial port.
- Deep Water Access: Select whether deep water access is required, preferred, or not required
- Barge Access: Select whether barge access is required, preferred, or not required
- Truck Max Dist to Major Hwy: Indicate how far (driven miles) the project can locate from a major highway.
- Intermodal Access: Select whether intermodal access is required, preferred, or not required
- Intermodal Max Dist to Facility: Indicate how far (driven miles) the project can locate from an intermodal facility.
- Electric Connected Load: Indicate the average required electric load in megawatts.
- Natural Gas Demand: Indicate the average required natural gas demand in MCF per hour.
- Industrial Water Requirement: Indicate the required industrial water required per day (total gallons per day).
- Portable Water Requirement: Indicate the required potable water required per day (total gallons per day).
- Sanitary Sewer Volume: Indicate the required sanitary sewer capacity required per day (total gallons per day).
- Industrial Wastewater Volume: Indicate the required industrial wastewater capacity required per day (total gallons per day).
- Solid Waste Volume: Indicate the total anticipated solid waste volume per year.
Project Dashboard – Client Representative
- Client Representative: This section allows a client representative’s information to be quickly accessed via the project page.
- Name: client representative name
- Title: client representative title
- Organization Name: client representative organization name
- Postal Address: client representative mailing address
- Office Phone: client representative office phone number
- Mobile Phone: client representative mobile phone number
- Email: client representative email address
- Website: client representative organization website url
Project Dashboard – Documents
- Project Description: The project description can be uploaded here.
- Project Schedule: The project schedule can be uploaded here.
- Attachments: Other attachments may be uploaded and accessed here.
Project Dashboard – Miscellaneous
- Charts: Link to the Charts Page
- Locations: Link to the Locations Page
New Project – Data Model
- Data Model: The data model can be used to upload an existing model structure or to develop a model.
- Upload Model button: A user may develop their own model as an excel file and upload it in the Load Project Model screen once the user clicks on the Upload Model button.
- Create Model button: A user may wish to develop their model in the application itself. This is possible by clicking on the Create Model button. The user will be routed to a blank model development page where the user can input criteria names, tags, and criteria as well as assign Tertiary Category to various analytical models.
- Add: Click the “+ Add” “text” to add a new primary, secondary, or Tertiary Category
- Add Primary (secondary, or tertiary) Criteria: Type the name of a new Primary Category and click the “Save” button to add a Primary Category
- Edit Criteria: Used to adjust a criteria’s name
Data Model – Edit Model
- Primary Category: The Primary Categories identify the broad categories of consideration for the project. A Primary Category score is comprised of one or more Secondary Category scores. The weighted Primary Category scores are combined to develop a total location score.
- Secondary Category: Secondary Categories identify more specific categories than Primary Categories. Secondary Categories are organized by the Primary Category they are associated with. This is so that the weighted Secondary Category scores will combine to become the Primary Category score. A Secondary Category is often made up of several Tertiary Categories.
- Tertiary Category: Tertiary Categories identify specific datapoints which are evaluated producing weighted scores that are combined to become the Secondary Category scores. A Tertiary Category generally contains one scored datapoint but other relevant (displayed) datapoints can inform the Tertiary Category score.
- Add: click to add a criteria
- Must: Select if the criteria pertains to the Must Analytic
- Want: Select if criteria pertains to the Want Analytic and should be scored
- Rel: Select if criteria pertains to the Want Analytic but should not be scored
- Cost: Select if criteria pertains to the Financial Analytic
- “text”: List criteria. This will display on the score page and the location data model page.
- Tag: The tag is used to identify and track each unique datapoint in the app database.
Want Analytic – Edit Model
- Weight: the relative importance of a criteria in relation to all other criteria at the same level. (represented in a percentage)
- Primary Total: The total of all weights assigned to the Primary Category.
- Secondary Total: The total of all weights assigned to the Secondary Category.
- Tertiary Total: The total of all weights assigned to the Tertiary Category.
- Totals (Red box): If a section total does not equal 100%, a red box will appear. This box will indicate how many percentage points a section’s total is from 100%
- Scoring Criteria: The scoring criteria section displays the criteria being scored below.
- For Reference: The list of criteria indicates all Scored and relevant (displayed) criteria. One criteria can be scored per Tertiary Category.
- Scoring: the star symbol indicates that a criteria is scored
- Display: the check mark symbol indicates that a criteria is displayed but not scored.
- Type: The criteria type dropdown box allows the user to choose from a “text” response, range, or list scoring approach.
- Criteria Tag: The criteria tag section displays the tag associated with the scored datapoint from the data model.
- Want Analytic – ““Text”” Criteria Type
- “Text” Score Type: Scoring Criteria are set to the “text” type by default when they are imported into the project Want Analytic. A scoring criteria “text” type doesn’t have the ability to be auto scored, so if a “text” type criteria is selected as the scoring criteria for a category, it will need further edits before auto-scoring can be performed. A “text” type scoring criteria will need to be changed to Range or List to allow data to be entered to facilitate auto-scoring. If a scoring criteria is left as a “text” type and scoring is run for the locations, that criteria will not be auto-scored. Any existing value in that criteria’s category score will remain.
Want Analytic – Range Criteria Type
- Range score type: The range criteria type allows a user to develop 2 or more value ranges with associated scores.
- Quantity: The quantity input box allows for numeric entry. The quantity number adjusts how many scoring ranges will be applied to the data.
- Response Range: The response range defines the upper and lower limits for each data range. The first response range upper limit is set by the first response range value entry while the lower limit is set to be anything less than the upper limit entry. The final response range lower limit is set by the final response range value entry while the upper limit is set to be any value above the lower limit entry. Each other range is defined by the prior range’s upper limit value and the new upper limit value for that range.
- Score: The score value sets a numeric score for the response range.
Want Analytic – List Criteria Type
- List Score Type: The list criteria type allows a user to define their own list of scoring titles and scores.
- Quantity: The quantity input box allows for numeric entry. The quantity number adjusts how many scored items will be included in the list.
- List Item “text”: Each entry box below the List Item “text” title represents a different consideration (i.e. high, medium, & low).
- Score: A numerical rating assigned to the unique list item provided to the left.
Must Analytic
Financial Analytic
- Revenue: Potential revenue
- Operating: Operating Expenses
- Investment: Investment Costs
- ESG Costs: Environmental Social and Governance related costs
- Add: click to add a criteria
- Active: The active selection box will engage a criteria if selected. This feature allow the user to easily toggle between two cost alternatives.
Financial Analytic - Formula
- Project Tags: This box provides a list of references to the values provided on the project information page.
- Financial Factors: This box provides a list of references to the values input in the cost factor section. The tags listed will match those input in the Financial Factors section.
- Location Tags: This box provides a list of references to location specific values input in the location upload. The tags listed will reference the location-specific data associated with each unique tag identifier.
- Formula: The formula section is a workspace which allows the user to develop various calculations they may require for each datapoint. The formula will apply across the model and individually calculate for each location.
Financial Analytic – Financial Factors
- Tag: This cell accepts “text” values which identify the associated value in the Financial Analytic in the “Financial Factors” box.
- Value: This cell accepts a numeric value which is associated with the unit of measure and can be multiplied in the Financial Analytic by a location or project tag.
- UOM: Unit of Measure – This cell allows for “text” input.
- $ Go to Formula: link to the Financial Analytic Formula page.
Charts
- Must Criteria Results: a pie chart which indicates how many locations were identified as “retain”, “marginal”, “eliminated”, or “withdrawn”.
- 2 x 2: composite chart which displays Operating Costs and the Want Analytic Quality Score.
- Conditional Factor Distribution: a pie chart that displays each Primary Category by weight.
- Subcriteria: a pie chart for each Primary Category that displays each Secondary Category by weight.
- Total Conditions Scoring: a stacked bar chart for each location indicating the location’s total score as well as each Primary Category score as a portion of the overall score.
- Revenue Costs: stacked bar chart of potential revenues by location.
- Operating Costs: stacked bar chart of operating costs by location.
- Investment Costs: stacked bar chart of investment costs by location.
- ESG Costs: stacked bar chart of ESG costs by location.
Charts – Must Criteria Results
- Padding: the four padding options adjust the margins around each graph image.
- Download Image: select this button to download a photo file (.jpg) of the chart.
- Locations Retained: Number of locations indicated as “retain” in the Must Analytic.
- Locations Marginal: Number of locations indicated as “marginal” in the Must Analytic.
- Locations Eliminated: Number of locations indicated as “eliminated” in the Must Analytic.
- Locations Withdrawn: Number of locations indicated as “withdrawn” in the Must Analytic.
Charts – 2x2
- Score Minimum: The left or lower extent of the chart (Quality score) varies based on this value.
- Score Maximum: The right or upper extent of the chart (Quality score) varies based on this value.
- Score divider: The vertical black line is automatically set to the average location score but can be adjusted to any value between 0 and 10.
- Bubble Size: The bubble size is automatically set to 10 but can be changed by typing any numeric value.
- Show legend: A user can select whether to display a legend by selecting “yes” or “no”.
- Download Image: select this button to download a photo file (.jpg) of the chart.
- Bubble Labels: The bubble labels can be located above, to the right, to the left, or below each bubble.
- Location Label Format: The location (bubble) label can be altered to display various information such as the location code, city and state, county and state, city and country, state and country, country, or the location code and the location name.
- Annual Operating Cost: Y-axis label – Costs are inverted so that lower costs are represented at the top of the chart.
- Qualitative Score: X-axis label – Quality scores listed from 0 – 10 from left to right.
Charts – Conditional Factor Distribution
- Primary Category: The Primary Category identify the broad categories of consideration for the project. A Primary Category score is comprised of one or more Secondary Category scores. The weighted Primary Category scores are combined to develop a total location score.
- Weight: the relative importance of a criteria in relation to all other criteria at the same level. (represented in a percentage)
- Padding: the four padding options adjust the margins around each graph image
- Download Image: select this button to download a photo file (.jpg) of the chart.
Charts – Subcriteria
- Padding: the four padding options adjust the margins around each graph image
- Download Image: select this button to download a photo file (.jpg) of the chart.
Charts – Total Conditions Scoring
- Location Label Format: The location (bubble) label can be altered to display various information such as the location code, city and state, county and state, city and country, state and country, country, or the location code and the location name.
- 15% below max score: This red vertical line indicates the score which is 5% below the maximum score among all actively selected locations.
- Locations to Include: a user can select or deselect locations identified as “retain”, “marginal”, “withdrawn”, or “eliminated”.
- Note: a user can hover their curser over a location’s bar to reveal each sections’ individual score. All other bars fade to the background slightly to highlight the bar in criteria.
- Download Image: select this button to download a photo file (.jpg) of the chart.
Charts – COSTS – Revenue, Operating, investment, ESG
- Location Label Format: The location (bubble) label can be altered to display various information such as the location code, city and state, county and state, city and country, state and country, country, or the location code and the location name.
- Locations to Include: a user can select or deselect locations identified as “retain”, “marginal”, “withdrawn”, or “eliminated”.
- Download Image: select this button to download a photo file (.jpg) of the chart.
All Locations - Location Page
- Refresh Scores: select this button to manually refresh the location scores.
- Export Want Results: Select this option to export the Want Analytic.
- Export Must Results: Select this option to export the Must Analytic.
- Export Financial Results: Select this option to export the Financial Analytic.
- Add/Update Location: select this option to add or upload location information.
- Location Info: Select this button to access the location information page.
- Scores: Select this button to access the location scores page.
- Filter: This dropdown list allows the user to filter the page by All, Active, or Inactive projects.
All Locations - Location Page – Location Card
- Several items are summarized on the location card. These include:
- Location name: large black “text” above the smaller green “text”
- Location Code: listed in smaller green “text” below the location name.
- Must Results: location card – must results
- Op Cost: location card - Operating Cost
- Score: location card - total location score
- Date: date the location card was created
Locations – Location info
- Scores: Select this button to access the location scores page.
- Data Model: Select this button to access the location-specific data model. The original response, an adjustable response box, data source, and comments box are available on the Tertiary Category page.
- Must Analytic: Select this button to access the location Must Analytic page.
- Financial Analytic: Select this button to access the location Financial Analytic page. All individual costs can be viewed and overridden in this model.
- Delete Location: The Delete Location button will permanently delete the location you are currently viewing.
Locations – Location info – Location Name & Address
- Location Name: Identify the location name
- Location Code: Identify a confidential location code
- Location Status: The project status dropdown list allows the user to indicate the project’s current standing.
- Closed: No longer active
- On Hold: May return to active status but not currently active
- Active: The project is currently under evaluation.
- Inactive:
Locations – Location info – Location Ownership
- Number of Owners: Identify the location’s number of owners
- Owner Name(s): List the location’s owner names
- Entity Type: Identify the Location ownership entity type (i.e. public, private, public/private partnership, etc.)
- Ownership Structure: Describe the location’s ownership structure
- Original RFI: The original RFI upload file can be downloaded by selecting the “view” option.
- RFI: Request for Information – Original location upload file.
- Attachments: A user can attach documents here.
Location – Scores
- Primary Category: The Primary Category identify the broad categories of consideration for the project. A Primary Category score is comprised of one or more Secondary Category scores. The weighted Primary Category scores are combined to develop a total location score.
- Secondary Category: Secondary Category identify more specific categories than Primary Category. Secondary Category are organized by the Primary Category they are associated with. This is so that the weighted Secondary Category scores will combine to become the Primary Category score. A secondary criterion is often made up of several Tertiary Category.
- Tertiary Category: Tertiary Category identify specific datapoints which are evaluated producing weighted scores that are combined to become the Secondary Category scores. A Tertiary Category generally contains one scored datapoint but other relevant (displayed) datapoints can inform the Tertiary Category score.
- WTD Score: Weighted score. Available at the primary and Secondary Category level.
- Weight: the relative importance of a criteria in relation to all other criteria at the same level. (represented in a percentage)
- Score: adjustable for the Tertiary Category. The primary and Secondary Category scores are static.
- Scoring Criteria Response: This adjustable field indicates the location’s response value. The response value can be overwritten.
- Response Range and score: the applicable scoring response range and scoring scale from the Want Analytic are listed below the location’s response value.
- Relevant Responses: Any relevant criteria and responses are listed to the right of the scoring range section.
Location – Must Analytic
- Retain: The location meets all Must requirements.
- Eliminated: The location does not meet all Must requirements.
- Marginal: The location meets most Must requirements but only partially meets certain must requirements in some manner.
- Withdrawn: The location has been withdrawn from consideration.
- Not Set: The location’s must score has not been determined.
Export – Data Request
- Include all criteria: The standard selection when exporting a Data Request is to include all model criteria regardless of which analytic model they may apply to.
- Include criteria from: This feature allows a user to export criteria only associated with certain models.
- Include Location information rows: Each data request and location upload file require 27 rows of standard data. If this check box is selected the exported data request will include those 27 rows of data.
- Export: The export button will initiate a compilation of the model and download a Microsoft Excel file known as the Data Request.
Export overview
- Export Want results: This button will export the Want results in excel format. The Want results are comprised of five worksheets. Three worksheets provide the raw scores for each primary, secondary, and tertiary criterion, respectively. A fourth worksheet represents the Tertiary Category raw scores while the fifth and final worksheet lists all criteria, weights, and scores in one document.
- Export Must Results: This button will export the Must results in excel format. The Must results are comprised of two tabs which include the must screening, comments, and recommendation for each evaluated factor.
- Export Financial Results: This button will export the Financial Analytic in excel format. The Financial Analytic is comprised of two tabs which include the Financial Factors, location inputs, and a preliminary cost analysis for each location.
- MISC –
- Industry Project Profile: An Industry Project Profile (Project Profile) is a Location Shepherd project which has been customized to simulate how the select industry would evaluate locations and communities. Each Project Profile is based on an Industry sector or subsector. The industries key drivers, must requirements, and preferences are accounted for throughout the project structure. No data is provided for a Project Profile but the model categories (primary, secondary, tertiary), relevant criteria, project information, scoring scales and key calculations come preloaded in each Project Profile. An Industry Project Profile user need only to export the data request and upload location data to begin their evaluation.
Terms requiring a definition:
Location Dashboard
Project Dashboard
For Reference
Financial Estimates
Location Data
Filter> “Inactive”