Purpose: The Project Dashboard page provides the user with key project information in a quick-reference format, as well as a place to store important project documents.
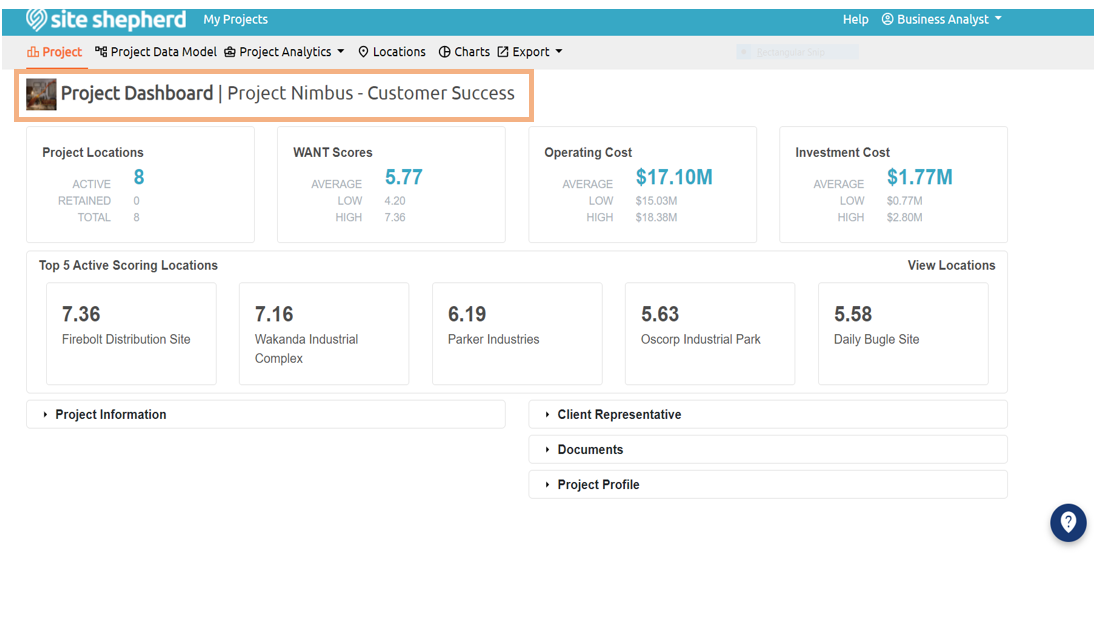
Overview: Key Performance Indicators (KPIs), such as the number of Project Locations, WANT Scores, Operating Cost, and Investment Cost, provide users with high-level project insights. The list of the top-scoring locations provides a user with a snapshot of the top performers. The Project Dashboard also allows a user to add, edit, or review project-specific information regarding industry product, employment, capital investment, building and site information, logistics, and utilities. Project documents are also stored on this page.
How To: A user can select any of the KPI tiles by clicking on the desired tile. Selecting any of these tiles automatically redirects a user to the respective tile’s chart in the project’s chart page. A user can add, edit, or remove information about the project, client, and project documents as reviewed in the Project Information, Client Representative, Documents, and Project Profile articles.
Note: A user does not need to select save or any other button for changes in the Project Dashboard to take effect – the changes are saved automatically.
Where Do You Find the Project Dashboard?