Purpose: The Want Analytic evaluates multiple project criteria within a structure that allows users to define what is important for the project. The Want Analytic analyzes a variety of criteria to produce a score in a weighted scoring model approach.
Overview: The Want Analytic, located under the Project Analytics dropdown menu in the app taskbar at the top of the screen, allows users to define the weights and scores to fully customize the weighted scoring model and produce scores that are assigned to each location. This analytic allows users to easily adjust weights for each category. Users can also add or edit the scoring type and scoring scales in this analytic.
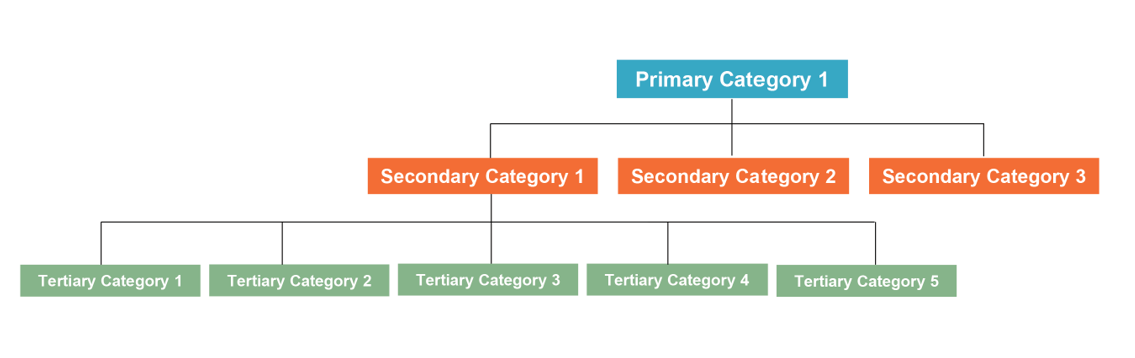
The Want Analytic follows the tri-tier organizational approach defined in the Data. The tri-tier approach organizes all data into scored categories beginning at the bottom with the Tertiary Category where raw data is scored. Once weights and scores are assigned, each tertiary category score is multiplied by its assigned weight. The combined Tertiary Categories are then grouped into a Secondary Category and their scores are combined. This Secondary Category’s score is the total score produced by all of the weighted Tertiary Category scores. The Secondary Category is then grouped with other Secondary Categories and multiplied by their assigned weights. Each Secondary Category score is then multiplied by the assigned weight and assigned to a Primary Category where the Secondary Category weighted scores are combined to develop the Primary Category score. Once this is completed for each Primary Category all the Primary Category scores are multiplied by their assigned weights then combined to provide the location’s overall weighted comparative score.
Where Do You Find the Want Analytic?

Tri-tier Organization Chart
Tri-tier Organization within the App
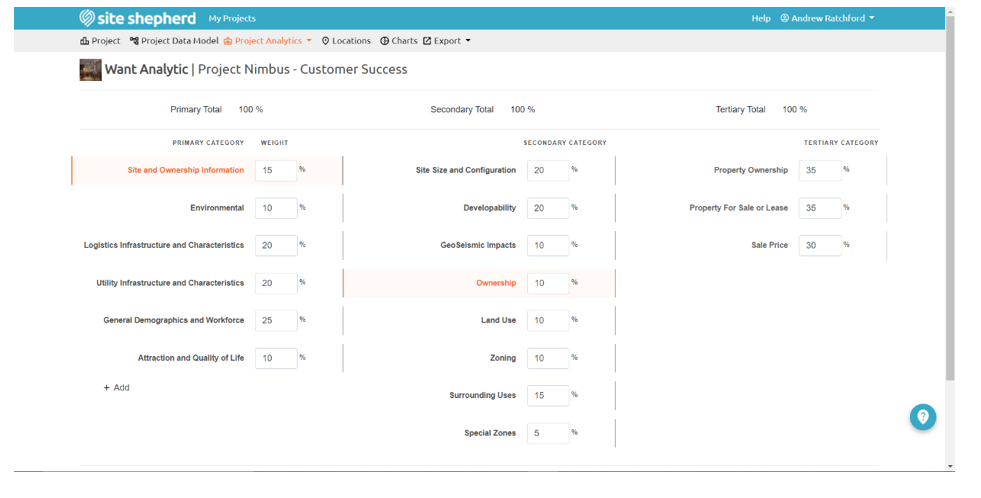
How To: When a user navigates to the Want Analytic page they will see the Primary Category column which displays each category and their associated weight. Selecting a primary category reveals all associated Secondary Categories and their weights. Likewise, a user can select a Secondary Category to reveal all associated tertiary categories and their weighted values.
A user can adjust the project’s category weights by entering a value in the entry box to the right of a category title. The values for each category title are added together and must equal a total of one hundred percent (100%). If the collective values do not equal 100% a red value will appear at the top and bottom of that column to indicated how many value points from 100% the total is (i.e. a red negative five (-5) notice tells a user that the values in that category level).
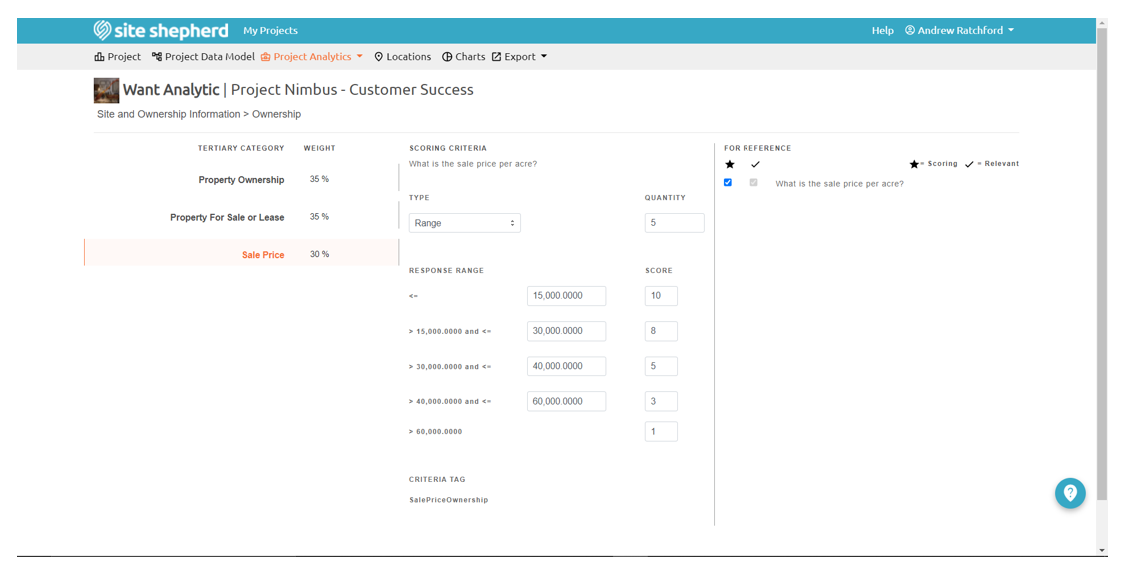
A user can also select a Tertiary Category to reveal another page. This page displays the scoring criteria section. A user can add or edit scoring types (range and list) and scales on this page for the scoring criteria (question) assigned to that tertiary category in the Data Model. The Text scoring type is a default blank or null score. A user needs to change this to Range or List and set a scoring scale if that scoring criteria is to produce a score.
If a user selects the Range scoring type from the Type dropdown box, the user will need to define how many response ranges should be scored. This value is entered into the Quantity text box. A user can then define the first response range. The first response range value defines the first response range as the entered value and all values below that value. The manually entered first response range value then becomes the lower end of the next response range. The user then needs to set the upper value of that next range (note that manually entered values are assigned less than or equal assignments). Continue this process for as many response ranges as are required. The final response range value will automatically set the final response range. The final response range will be any value above the last manually entered response range. In the example below, the final response range was 60,000. Once response ranges are set, a user must assign scoring values from 1-10 must be assigned to each response range in the Score column.
If a user selects the List scoring type from the Type dropdown box, the user will need to define how many list items should be scored. This value is entered into the Quantity text box. The user can then enter the first list item in the left first text box below the List Item Text label. Additional list items can be input in text boxes below in the same column. Once all list items have been entered a user can add/edit the category weights by entering a whole value in the text box provided to the right of each category title.
A user can also hover to the right of the percentage symbol next to each category and notice an “X” symbol that appears - this button can be selected to delete a certain category.
A user can add a category by selecting the Add button at the bottom of the Primary Category. This button will redirect the user to the project’s Data Model where categories can be added.
List Scoring Type Example

Range Scoring Type Example