Purpose: The Financial Analytic allows users to define revenue and cost calculations for all locations in a single location without need to calculate costs independently for each location.
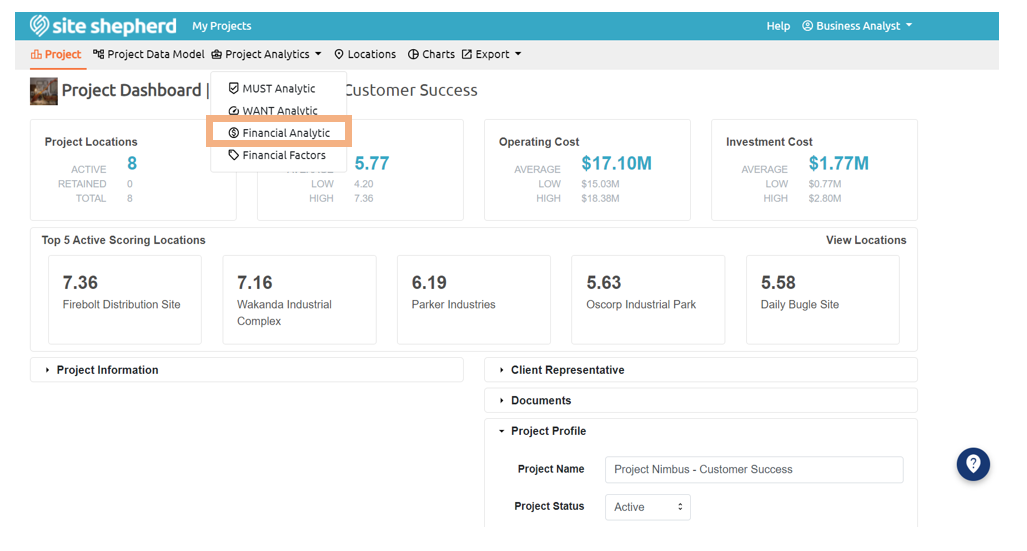
Overview: The Financial Analytic, located under the Project Analytics dropdown menu in the navigation bar at the top of the screen, allows users to build revenue and cost calculations globally for each location. The Financial Analytic allows users to reference project information from the Project Dashboard, financial factors from the Financial Factors section, and all location specific cost information by referencing “tags” when a user builds their cost or revenue formula.
When a user arrives at the Financial Analytic, they will see a Primary Category column with four options: Revenue, Operating, Investment, and ESG Costs. The Secondary Category column appears once a user selects the desired Primary Category. Likewise, the Tertiary Category column appears when a user selects the desired Secondary Category. Users can add, label, and remove cost categories in the Secondary and Tertiary category columns. A user can also select the Tertiary Category by clicking on the Tertiary Category title to reveal that Tertiary Category’s formula page. Tertiary Categories can also be set as Active or Inactive. Tertiary criteria are set to Active by default. If a Tertiary Category is manually set to Inactive that category’s calculation and result will be removed from the remainder of the project. Reference the page layout and icons associated with adding, editing, and removing categories by reviewing the Financial Analytic Modifications below.
Each Primary Category is represented in a different chart in the charts section. Each Secondary Category represents as a different color in the stacked bar charts when the costs are displayed in the cost charts section of the app.
Formula Page
Once a user selects the Tertiary Category they are redirected to the Formula page which is comprised of the Project Tags list, Financial Factors list, Location Tags list, and Formula section.
- The Project Tags list references data that was input on the Project Dashboard Project Information section.
- The Financial Factors list references any manually input financial factors developed in the Financial Factor section.
- The Location Tags list includes all location specific criteria that were assigned in the Data Model to the Financial Analytic by selecting the Financial option.
Once a user is ready to construct a formula, the user needs to select the appropriate project, cost, or location tags, input the appropriate operator function, then input the value or another tag before saving the formula.
Where Do You Find the Formula Page?
How To: A user can add categories by selecting the Add button. Once the category is added, a user is prompted to name the category.
A user can hover their cursor over the Secondary or Tertiary category title to reveal an “X” symbol. A user can select this button to delete the associated category.
Note: if a user chooses to delete a Secondary Category with one or more tertiary categories, those Tertiary Categories will all be deleted.
A user can also select the Tertiary Category by clicking on the tertiary category title to reveal that Tertiary Category’s formula page. Tertiary Categories can also be set as Active or Inactive. Tertiary categories are set to Active by default. If a Tertiary Category is manually set to Inactive, that category’s calculation and result will be removed from the remainder of the project.
If a user selects the Add button to the right of the Financial Factors title, the user will be redirected to the Financial Factors section of the app.
Once a user is ready to construct a formula, the user needs to select the appropriate project, cost, or location tags by double clicking them. Once Tags are selected, there will be hash symbols (#) included on both ends of the tag.
- The formula can continue inputting the required operator functions +, -, *, /, and () and selecting another tag or by entering a numerical value.
- Note: a user does not need to input an equal sign at the beginning of the formula. The user must click the “save” button below the formula section to retain the formula addition. If a user wishes to include a precalculated cost that was uploaded for each location, a user must double click that location tag in the formula section and save it.
- Example: A typical cost calculation example may be electric operating cost. This calculation utilizes some project specific information from the Project Dashboard (required electric load), some manually entered specific global information from the Financial Factor section (demand factor), and location specific information such as the electric rate from the location data upload. Additionally, the user will need to add some numeric values to align the required demand with the rate. In this case, the days (360) and hours of operation (24) are entered as numeric values and the megawatt demand is converted to the kilowatt demand (divide by 1,000) using numeric values. This approach allows a user to write one formula that references groups of data specific to many locations empowering the software to automatically calculate the cost for each location.