Purpose: The Must Criteria Results chart allows users to view how many locations were retained, eliminated, marginalized, or withdrawn based on the Must Requirements outlined by the user.
Overview: The Must Criteria Results chart, accessed by selecting the Must Criteria Results button located under the Results column on the Charts page, allows users to view an image and download a .jpg file of the chart to display how many viable locations have been retained based on the project defined Must Requirements in the Must Analytic.
Where Do You Find the Must Criteria Results Chart?

How To: A user can adjust aspects of the Must chart such as the font size and padding (the space between the border and where the graph begins) on all four sides by modifying the numbers located in the boxes directly above the chart.
Note: Larger padding numbers increase the padding or margin size while smaller numbers decrease the padding or margin size.
Must Chart Modifications
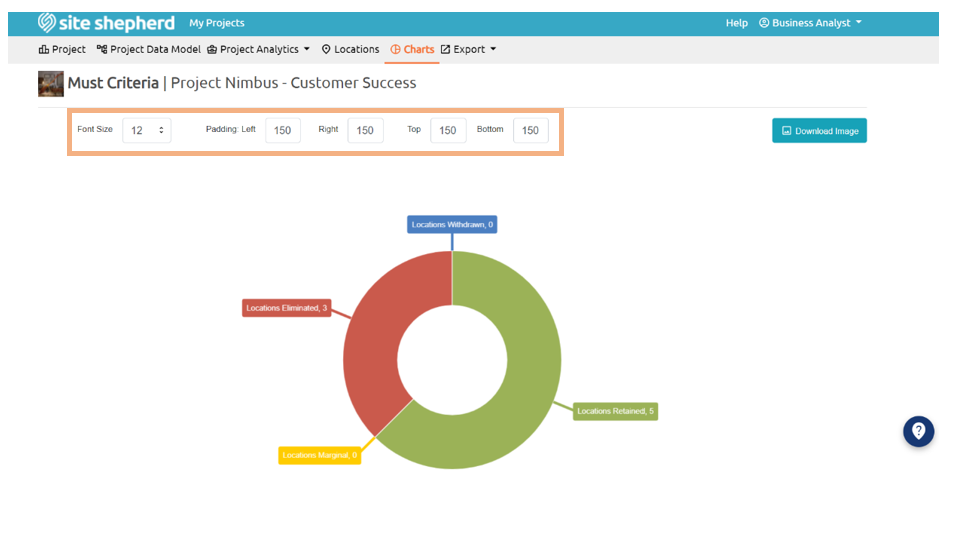
A .jpg file of the chart image can be downloaded by selecting the Download Image button located in the top right-hand corner of the page.
Download Image Button
