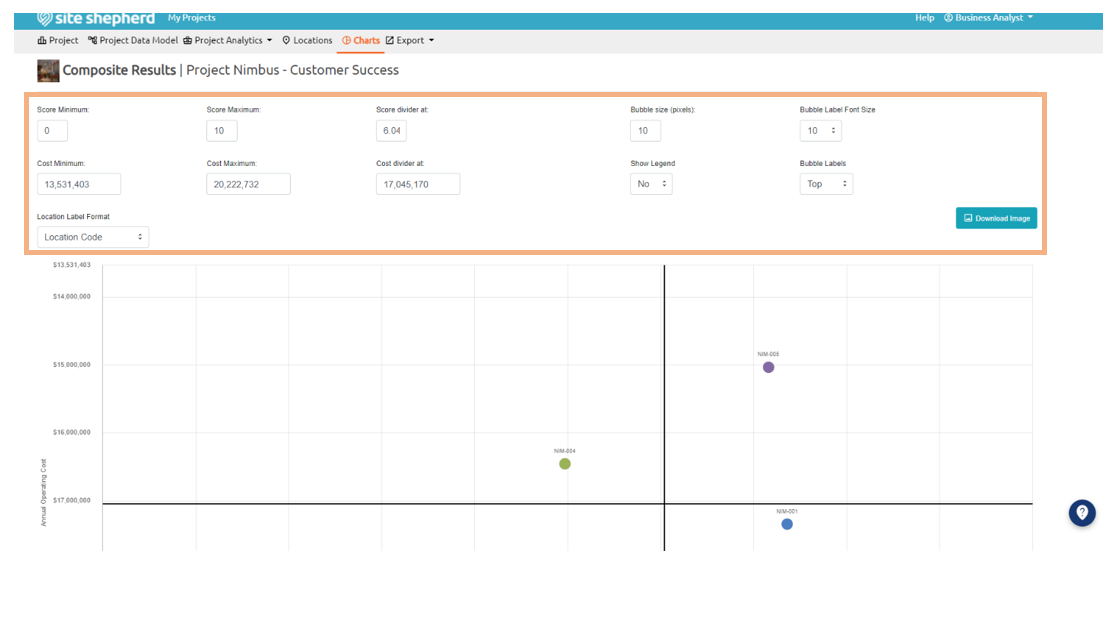
Purpose: The Composite Results chart allows users to view both the operating costs and the qualitative scores for each location based on the Want Analytic results in a combined chart.
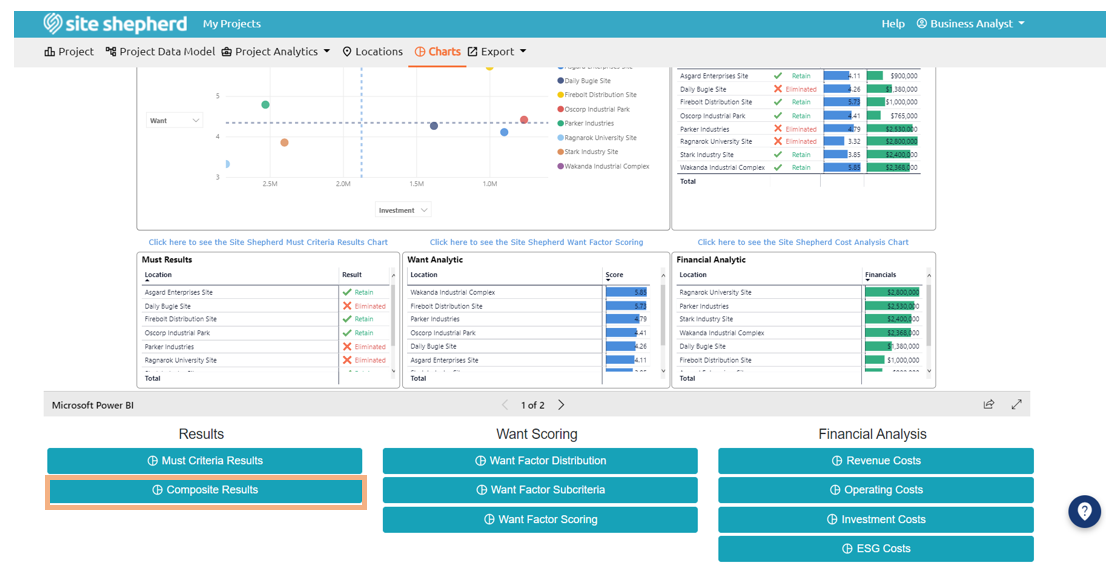
Overview: The Composite Results chart, accessed by selecting the Composite Results button under the Results column on the Charts page, allows users to visualize and quickly identify the most optimal location (or least optimal location) based on its score from the Want Analytic (Want Scores) and the location’s annual operating costs. Annual operating costs are located on the vertical axis, with the top of the chart being the least expensive and the bottom being the most expensive. Want Scores are represented along the horizontal axis, with Location Scores improving (increasing in value) from left to right.
The Composite Results chart is divided into quadrants by two divider lines. The vertical line represents the average Want Score (referred to as the Score Divider). The horizontal dividing line represents the average Operating Cost (referred to as the Cost Divider). A dot or bubble on the chart represents a location that has been evaluated. Locations in the top right quadrant have favorable Operating Costs and relatively high Want Scores (low cost and high quality), while locations in the lower left quadrant have unfavorable Operating Costs and poor Want Factor scores (high cost and low quality).
Where Do You Find the Composite Results Chart?
How to: A user can modify the following aspects of the Composite Results chart: the minimum (min) and maximum (max) qualitative score displayed on the x-axis, the min and max operating costs displayed on the y-axis, the score and cost dividers, the data point size, location label font size, placement of the location label, and the format of the location label.
- To adjust the min and max costs as well as the Want Scores, a user can manually input the range they would like to use to determine the range for the x- and y-axis by adjusting or inputting new values in the Cost Minimum and Cost Maximum value boxes.
- The score divider and cost divider values can be adjusted to change the divider values. These values are based on the average score and average cost values for each active location in the data set. Adjusting the dividers may shift locations from one quadrant to another which can dictate if a location appears more favorable or less favorable.
Note: Once a divider value is manually overwritten, the average value can be restored by exiting the Composite Results page then returning to that page. A user can also reload the page to reset the Composite Results values
- A user can change the format of the label for each location data point from the location code to the city, state, country, or location name.
- A .jpg file of the chart image can be downloaded by selecting the Download Image button located in the top right-hand corner of the page.
Composite Chart Modifications