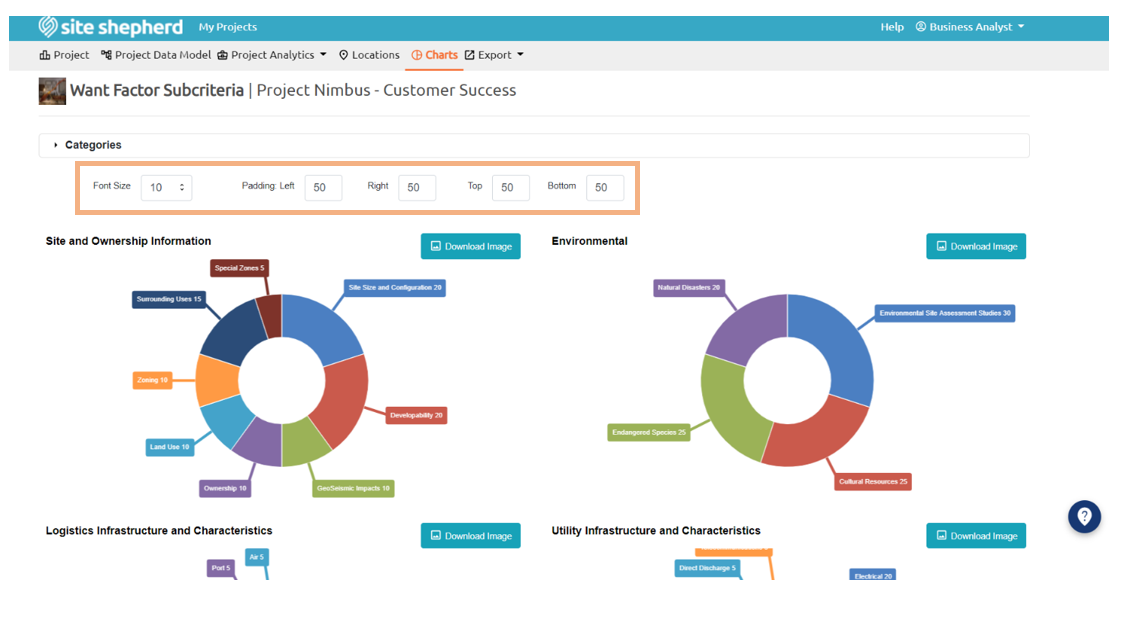
Purpose: The Want Factor Subcriteria charts allow users to view the relative importance of each Secondary Category that comprises a Primary Category.
Overview: The Want Factor Subcriteria charts, accessed by selecting the Want Factor Scoring button under the Want Scoring column on the Charts page, allow users to view how each Secondary Category has been weighted in relation to one another and provides a visual of the weight assigned for each category used throughout the evaluation of the locations. Each pie chart represents a Primary Category. Each slice or section in the pie chart represents a separate Secondary Category.
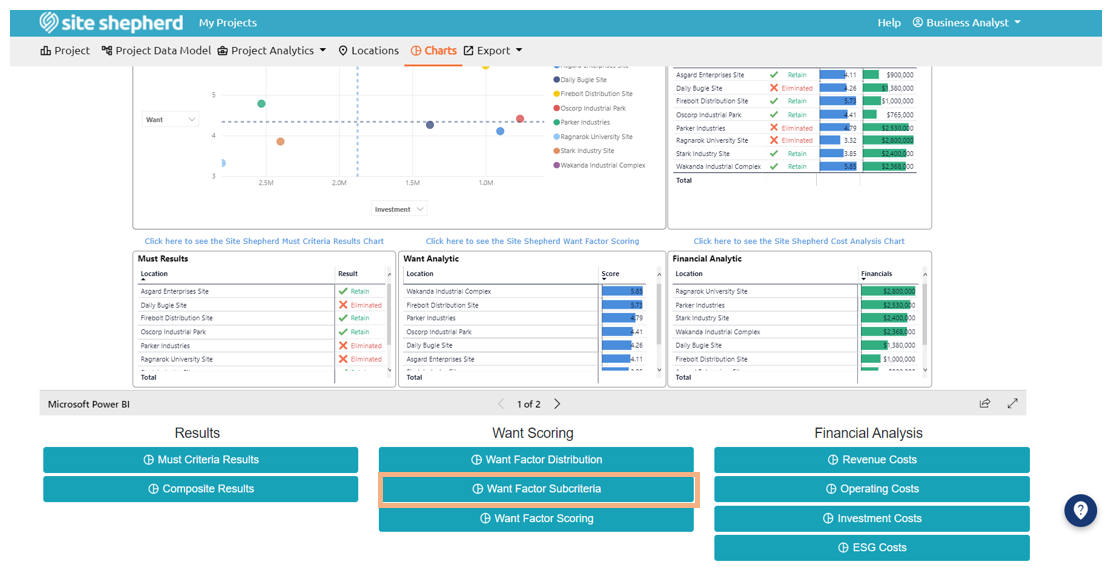
Where Do You Find the Want Factor Subcriteria Chart?
How to: A user can adjust the font size and padding (the space between the border and where the graph begins) on all sides of the chart by manually changing the numbers located directly above the Want Factor Distribution chart.
A .jpg file of the chart image can be downloaded by selecting the Download Image button located in the top right-hand corner of the page.
Want Factor Subcriteria Chart Modifications