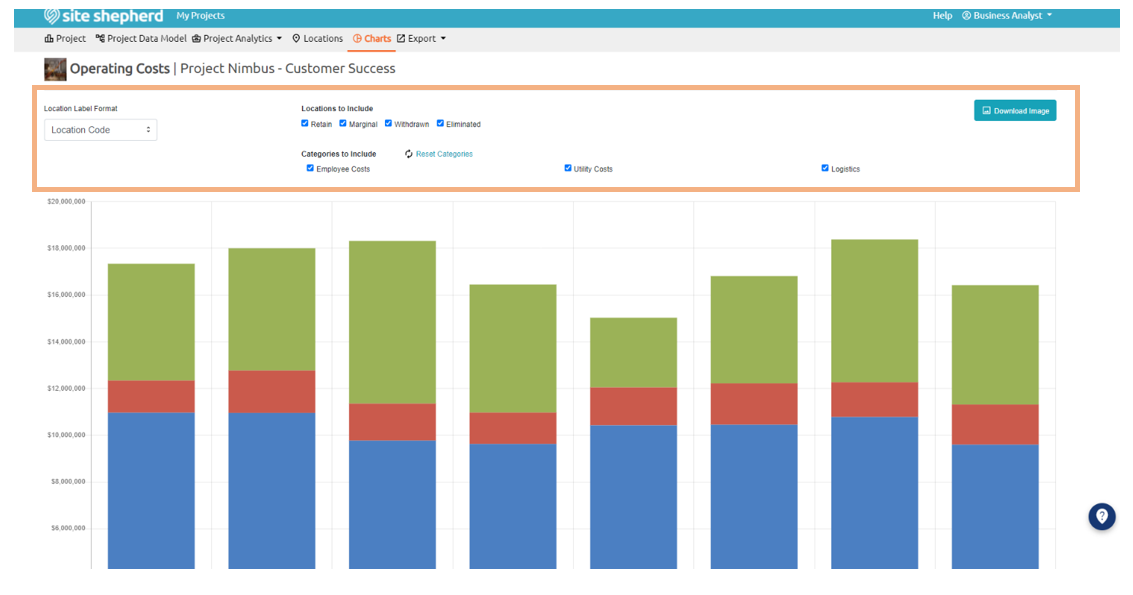
Purpose: The Operating Costs chart allows users to view the anticipated operating costs for each location.
Overview: The Operating Costs chart, accessed by selecting the Operating Costs button located under the Financial Analysis column on the Charts page, displays the anticipated operating costs for each location based on the available information used in evaluation. The chart displays the estimated annual costs for each location in a stacked bar chart format which allows a user to quickly reference the total anticipated annual costs as well as the value for each cost component. Each cost component is displayed in a different color to differentiate its value as a part of the overall cost for that location. The cost component colors are consistent across each location to allow for quick comparison of categorical costs.
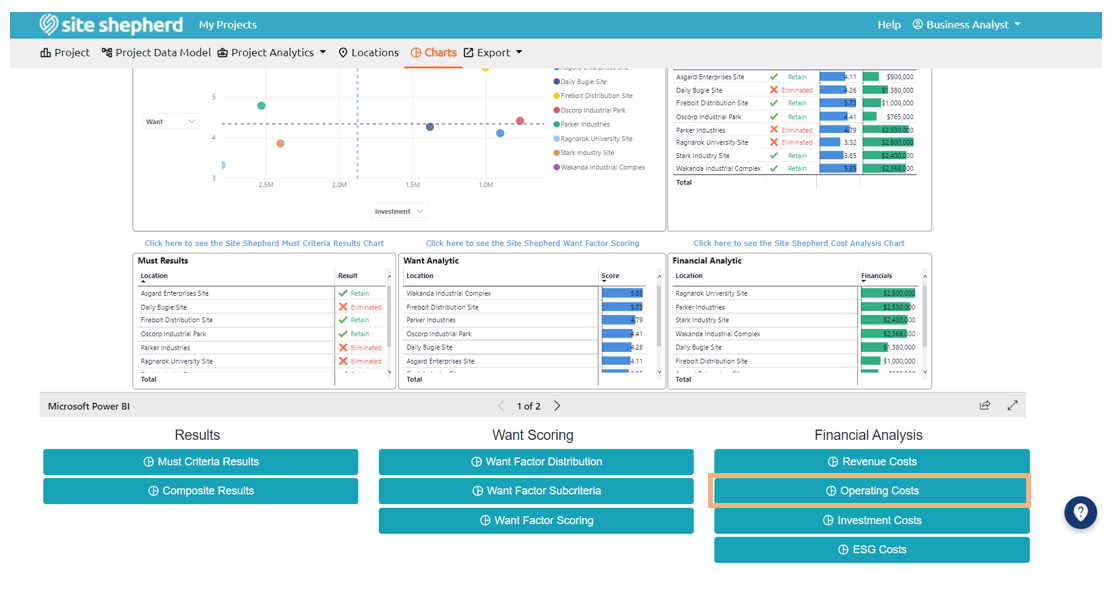
Where Do You Find the Operating Costs Chart?
How to:
A user can adjust the format of the location labels on the chart by using the Location Label Format dropdown bar in the top left-hand corner.
A user can also change what type of locations are included in the chart by selecting and/or deselecting Retained, Marginal, Withdrawn, Eliminated, or any combination of the four options.
Below the options for Locations to Include, a user can determine what categories within the Operating Costs to compare by selecting and/or deselecting Employee Costs, Utility Costs, and Logistics for each location.
A .jpg file of the chart image can be downloaded by selecting the Download Image button located in the top right-hand corner of the page.
Operating Costs Modifications